Up-to-date information on water resources is vital for planning and adapting operations that rely on water.
The Department of Water and Environmental Regulation (the department) tracks rainfall and streamflow in the South West Land Division (SWLD) over winter and spring to help prepare for summer. This helps the community and State Government to:
- respond to yearly changes in rainfall and streamflow
- investigate the rainfall and streamflow ranges that may occur
- collectively prepare for potential dry periods or other rainfall impacts
- coordinate any required response to manage industry, agriculture and drinking water supplies.
Compared with decades ago, more rainfall is needed now to recharge water resources to those historical levels because climate change is altering the way our water systems respond to rainfall. However, intense events can still cause localised flooding. Summaries of winter/spring rainfall and streamflow are found below.
This summer, government is also tracking groundwater levels and temperatures to help the community respond to summer conditions. Temperature affects both water use and groundwater recharge. The tracking information that follows is based on representative bores across the SWLD.
For more information, please email info@dwer.wa.gov.au.


Rainfall and streamflow 2024 overview
Show moreRainfall
Long-term trends show declining rainfall in south-west WA (see ‘Climate context’).
Rainfall for 2024 (to November) varied across the region, from above average to lowest on record. It was:
- above average at Geraldton, Roelands and Dalwallinu
- average at about half of the department’s SWLD tracking sites
- below or well-below average at around half of the sites
- lowest on record at Kellerberrin and Kalgan River.
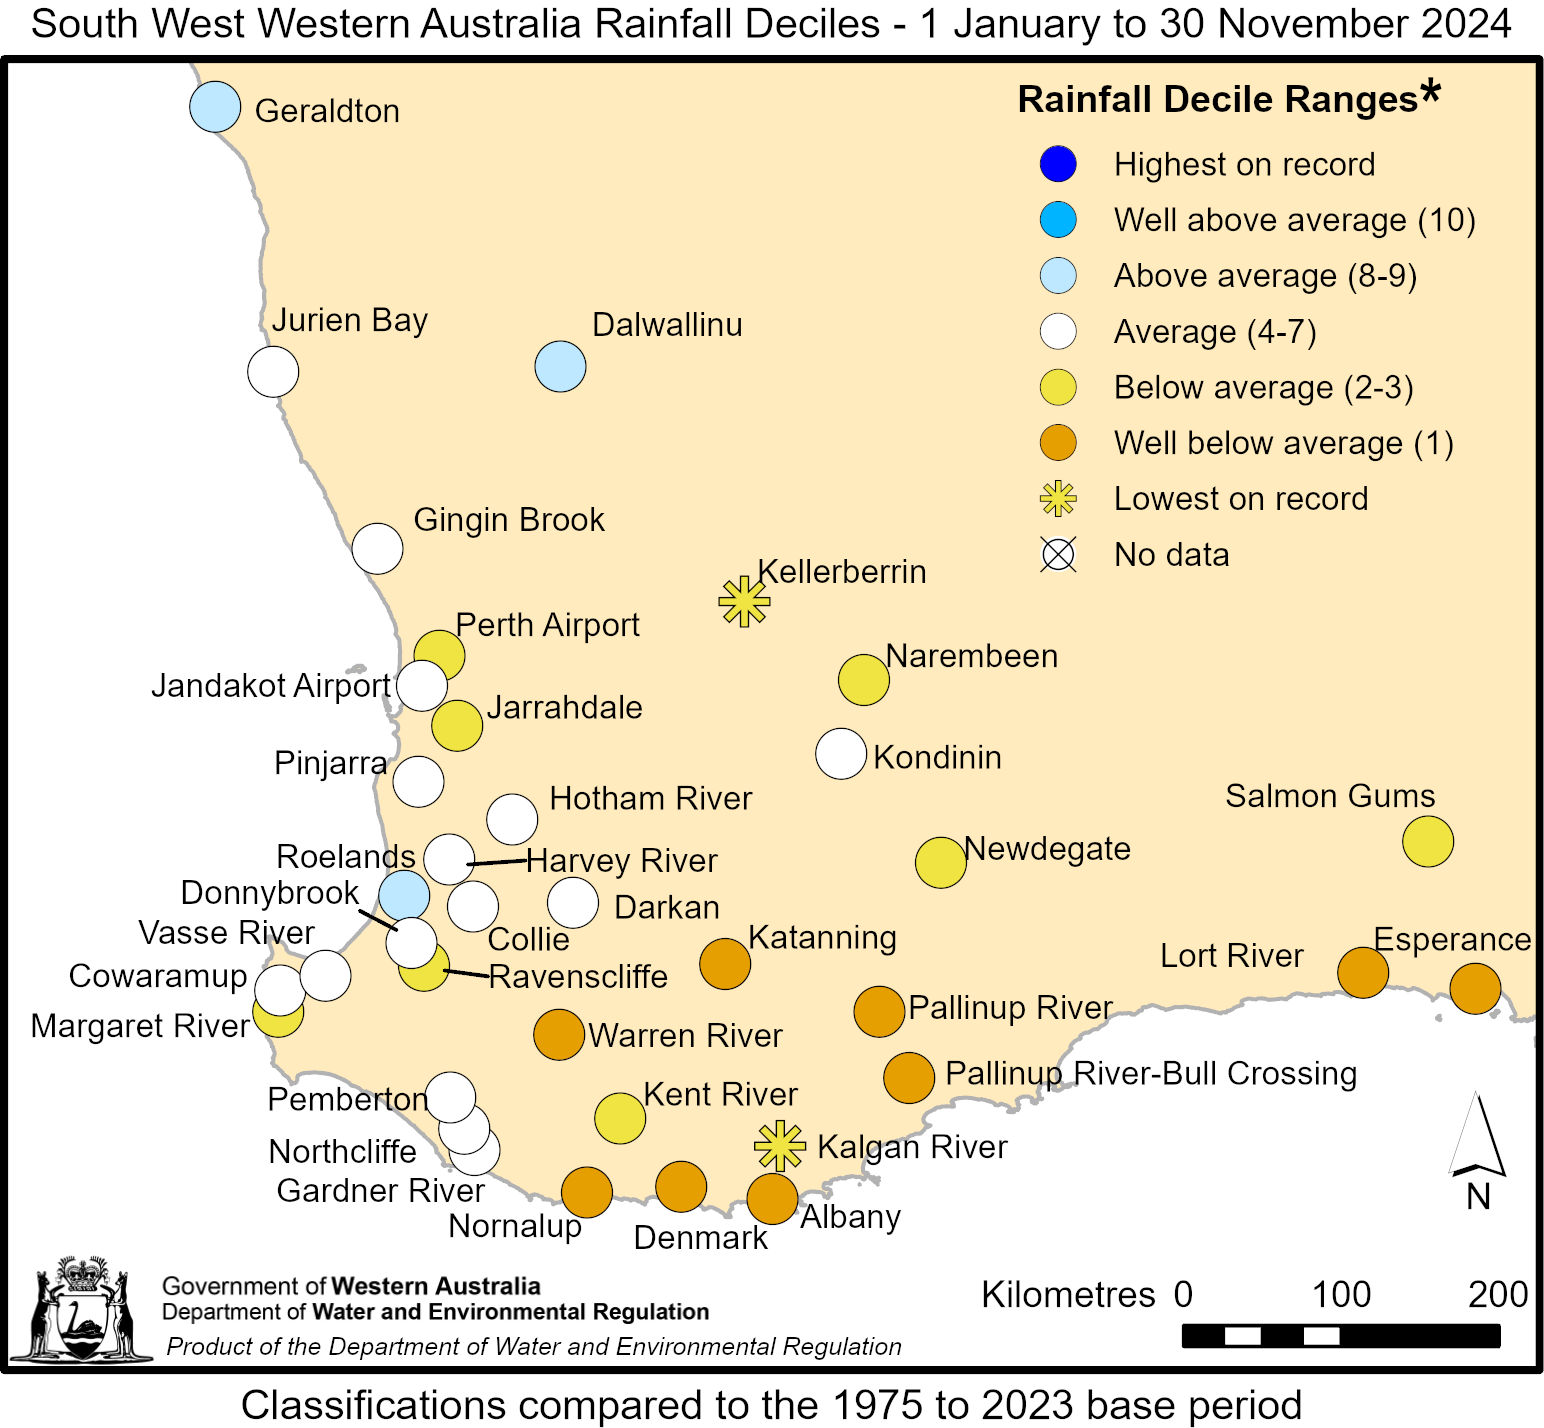
Rainfall deciles for November for the SWLD
* A rainfall decile is a way to compare the amount of rain for a particular place and period. The rain volumes at each location for the same calendar period for each year between 1975 and 2023 are ranked from least to most and then divided into 10 groups. The first group (‘decile 1’) contains the lowest 10 per cent of rainfall so it is the driest 10 per cent of measures and is considered to be a well-below average amount of rain. At the other end of the spectrum, ‘decile 10’ contains the highest/wettest 10 per cent of measures and is considered to be well-above average rainfall. The coloured circles in the map show how a 2024 rain amount fits with these 10 groups of ranked historical rainfall.
Streamflow
The varied rainfall conditions across the SWLD resulted in streamflow ranging from average to lowest-on-record for January to November 2024.
- More than 50 per cent of locations have recorded below average or lower streamflow for 2024 (to November).
- Gingin Brook has had lowest-on-record streamflow for the year to date.
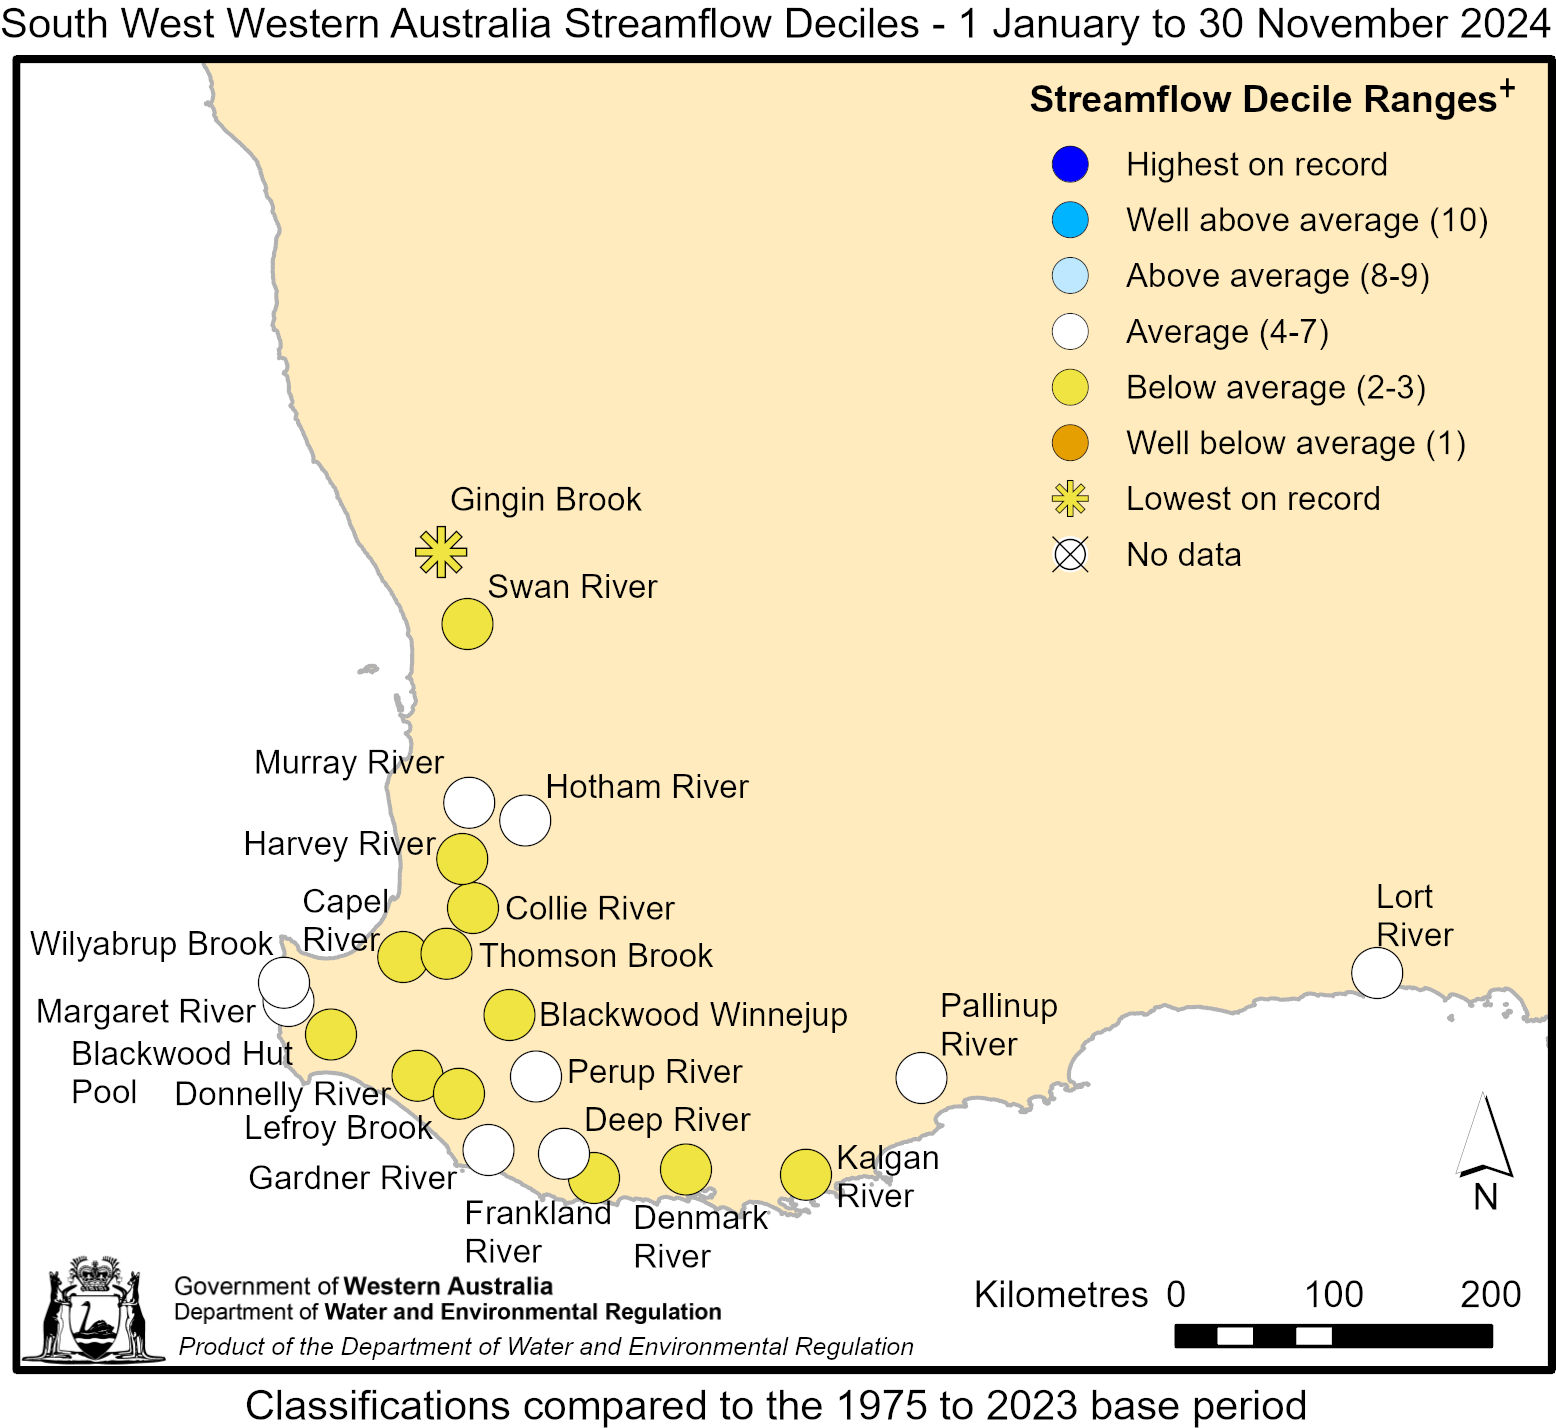
Streamflow deciles for November for the SWLD
† A streamflow decile is a way to compare the amount of water flowing in a stream, river or other channel for a particular place and period. Streamflow at each location for the same calendar period for each year between 1975 and 2023 are ranked from least to most and then divided into 10 groups. The first group (‘decile 1’) contains the lowest 10 per cent of streamflow and is considered to be well-below average streamflow. At the other end of the spectrum, ‘decile 10’ contains the highest 10 per cent of measures and is considered to be well-above average streamflow. The coloured circles in the map show how a 2024 streamflow fits with these 10 groups of ranked historical streamflow.
Temperature – March 2025
Show moreTo complement the groundwater tracking we are undertaking for the SWLD, we will also regularly update the mean maximum observed temperature and temperature forecasts, along with rainfall forecasts, produced by the Bureau of Meteorology.

Mean maximum temperature (°C) for March 2025
Source: Climate Maps - Temperature Latest
The mean maximum temperatures in March for the South West were very much above average or highest on record, with mean maximum temperatures ranging from 24 to 36 degrees.
Seasonal forecast
Show moreWhen considering forecasts, it is important to look at the forecast and the forecast model’s accuracy. Model accuracy is a measure of how well the forecasts matched real records previously.
Maps 1 and 2 below show the temperature and rainfall forecasts for Australia using Bureau of Meteorology modelling, while maps 3 and 4 show the modelling accuracy of these forecasts (i.e. how well the model has previously forecast the weather at that time of year).


As of 3 April 2025:
- The Bureau of Meteorology expects warm conditions to continue, with an over 80 per cent chance of exceeding the median maximum temperatures for the SWLD in April–June (Map 1).
- The accuracy of the temperature forecast is 65–75 per cent in the SWLD. This indicates a high level of confidence in the forecast (Map 3).
- The rainfall forecast suggests below average rainfall for the April to June period with most areas across the SWLD indicating a 25 to 40 per cent chance of exceeding median rainfall.
- The accuracy of the rainfall forecast is 55–75 per cent in the SWLD. This indicates a moderate to high level of confidence in the forecast (Map 4).1
Climate context
Show moreIn winter 2024, climate change impacts saw temperatures remain well above short- and long-term averages for the SWLD, with the mean maximum and mean minimum temperature all the highest on record.
While we had several large rainfall events, with some spots recording the highest on record for the past 20 years, streamflow and recharge need steady, regular rain to soak our catchments and get water flowing.
Rainfall decline in south-west WA has been greater than anywhere else in Australia. Almost all climate projections indicate a warmer and drier future for the region, marking it a global hotspot for reduced rain because of climate change.
Since the 1970s, in south-west WA there has been:
- a 16 per cent decline in April–October rainfall2
- about 80 per cent less flow into Perth’s water supply dams3
- up to 70 per cent less recharge to groundwater.4
Climate change poses significant challenges for communities in WA that are experiencing more extreme weather events such as tropical storms, floods and bushfires. The State Government is supporting businesses, communities and local governments to understand the future climate and adapt to the impacts of climate change.
The Climate Science Initiative will produce the most detailed and comprehensive Western Australian climate change projections to date, extending to the year 2100.
Useful links, water management responses, and bibliography
Show moreUseful links
The department’s:
- river level data
- rainfall data at river monitoring stations
- water information reporting tool – access more of the department’s monitoring data, such as groundwater levels
- rural water planning – information on departmental assistance to farmers
- Climate Science Initiative – for long-term climate modelling
The Department of Primary Industries and Regional Development’s:
- rainfall to date tool – graphs the rainfall amount accumulated from the start of the grain growing season, and the projected range of finishes to the season, for a selected weather station
- monthly seasonal climate outlook newsletter – summarises data from their network and the Bureau of Meteorology.
The Bureau of Meteorology’s:
- rainfall and other climate data for a selected weather station
- seasonal streamflow forecasts
- water storage summary
- climate outlook information – includes rainfall and temperature forecasts (for 1-week, 2-week, 1-month and 3-month periods). For example, a map of the chance of exceeding median rainfall (and the accuracy of this forecast).
For more information, email groundwater.info@dwer.wa.gov.au
Departmental water management responses
The department manages water proactively and reactively. We are:
- delivering the Community Water Supplies Partnership program which boosts water infrastructure upgrades and improvements in 37 local government areas (LGAs) across the dryland agricultural area
- continually communicating with LGAs on the probability of water deficiency declarations in areas where on-farm water storage is at a median level or lower
- assessing water resource conditions and reviewing allocation limits in priority areas
- implementing rural water and allocation planning, water licensing and climate adaptation programs to safeguard resources
- monitoring and managing key estuaries and rivers through the Healthy Estuaries WA and Healthy Rivers programs
- further supporting rivers through the Creating Climate Resilient Rivers project which supports rivers to cope with short periods of extreme conditions, and to adapt and evolve to longer-term changes
- developing and delivering a research program addressing key climate challenges for the WA water sector.
The State Government has invested $25 million in the Lower Great Southern Towns Water Supply Scheme. A response to years of declining rain, the project now ensures Denmark is no longer solely reliant on rainfall for its drinking water. To date, more than $4.3 million has been committed to 37 local governments for projects to alleviate demand on scheme water and increase the availability of non-potable water supplies.
The State Government will also invest up to $15.3 million in key initiatives to improve water security for horticultural growers in the Manjimup–Pemberton region.
Bibliography
Bureau of Meteorology:
- Climate outlooks – weeks, months and seasons. www.bom.gov.au/climate/outlooks/#/rainfall/summary
- Climate and water long-range forecast. www.bom.gov.au/climate/outlooks/#/overview/video
- Western Australia in autumn 2024, 2 June 2024. www.bom.gov.au/climate/current/season/wa/summary.shtml
Footnotes
- Bureau of Meteorology. Western Australia, accessed 9 January, 2025. www.bom.gov.au/climate/current/season/wa/summary.shtml
- Lawrence, J, Mackey, F, Chiew, M, et al. Chapter 11: Australasia. Climate change 2022: impacts, adaptation and vulnerability – Australasia. Contribution of the Sixth Assessment Report of the Intergovernmental Panel on Climate Change.e. doi:10.1017/9781009325844.013
- Water Corporation. Streamflow. Accessed 30 August, 2024. www.watercorporation.com.au/Our-water/Rainfall-and-dams/Streamflow
- Gelsinari, S, Bourke, S, McCallum, J, McFarlane, D, Hall, J, Silberstein, R, Thompson, S, 2024, Nonstationary recharge responses to a drying climate in the Gnangara Groundwater System, Western Australia, Journal of Hydrology, Volume 633, 2024, 131007, ISSN 0022-1694, www.sciencedirect.com/science/article/pii/S0022169424004025
Essential information
The Bureau of Meteorology:
- issues weekly forecasts essential to the tracking information in this page; however, the department aims to update this webpage about monthly. The tracking information is relevant for the time of publication only; key information may have changed
- forecasts use a slightly different time period to the department’s historical tracking time period.
Disclaimer
The Government of Western Australia (State Government) is committed to quality service to its customers and makes every attempt to ensure accuracy, currency and reliability of the data contained in this page. This page is for information purposes only and the State Government cannot and does not represent or warrant that the document is free of errors, inaccuracies, faults or omissions. Changes in circumstances after time of distribution may impact the quality of this information. To the fullest extent permitted by law, the State Government and its officers and employees are released from liability (including in respect of negligence) for any loss, damage, cost and expense caused by use of or reliance on this document and the information contained on it.